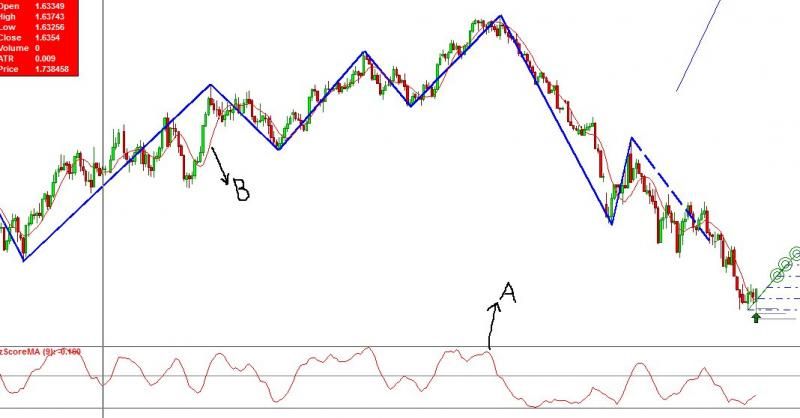
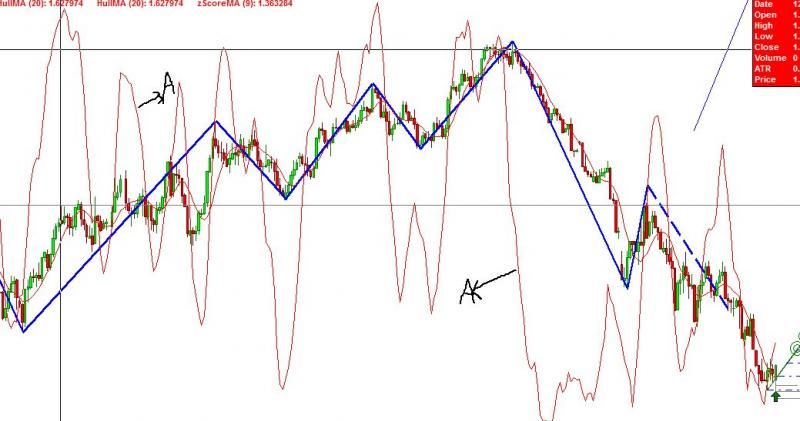
| julesrulesny Legend        Posts: 498 Joined: 8/28/2009 Location: NYC  User Profile User Profile | Hi Jim, Thanks for that offer -- I have hard time explaining myself at times.. So I'll def do my best. Especially if this is more complicated to do than I initially realized. Ok, if you can see in this zScore Pane -- Noted at "A".. Is the zScoreMA in the pane... I would like to apply it to my chart so it looks like the MA at point "B"..  As in zScore Chart image --- this is what happens when I apply the zScoreMA to my chart by moving it out of the pane..  I know that due to calculations, some indicators just wont work in the "chart" itself.. and only for use in an Indicator Pane.. However, I believe it can be done .. **for example, someone created "RSI Bands" out of RSI, which typically itself is only used in a pane.. So, basically I just did not know if I can change the calculations, or use a different Return Value, or Plot Price Value, etc.... So that the zScoreMA indicator can follow the Price more closely in the chart.. As opposed to this image of it being up and down all over the place when I moved it into the chart... (as you can see in the first image... when its in the pane, its relatively close to the actual movement of price trending up, down, sideways (when using the proper parameters of course.. But you can see the peaks and valley's, etc are all very close).. I hope this helps. Just looking for a lil direction and hopefully I can figure out how to do it. Always appreciate it Jim. Thank you, Marc [Edited by julesrulesny on 11/24/2014 4:14 PM] | |
