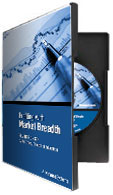
Profiting with Market Breadth
Seminar on CD by Jeff Drake
To be successful in the market, it is imperative to be aligned with overall market direction and to ascertain directional strength.
Most traders look solely at an index’s chart, such as the S&P 500, to determine where the market it heading. But indexes only tell part of the story. In order to understand what the market is doing as a whole, many savvy traders turn to Market Breadth indicators. Market Breadth indicators measure the performance of all the stocks on the major exchanges. By providing insight on how many of the stocks are participating in the current moves, we gain a much better feel for overall market sentiment.
In Profiting with Market Breadth, we show you how to use these indicators to quantify the direction and strength of the overall market. This seminar covers all of the major Market Breadth indicators and how they are calculated. It will also show you how each one is sued to help predict future market direction.
Seminar Outline
1. Introduction - Defining Market Breadth
2. How Market Breadth Analysis Helps Ups
3. Advancing Stocks vs. Declining Stocks
The Basis For MarketBreadth
- The Advance/Decline Line
- The ARMS (TRIN) Index
- The McClellan Oscillator
4. More Market Breadth Indicators
- The Bullish Percent Index
- Stocks Above Their Moving Average
- Stocks Making New Highs or Lows
5. The Put/Call Ratio
6. The Multicollinearity Issue
- Putting Too Much Weight on the
Same Information - Examples of Good Combinations
7. Visual Confirmation with Market Breadth
- Setting Up Your Charts
- Using the Chart Book
8. Automated Confirmation in
Trading Strategies
- Setting Up a Filter Block
- Examples
Profiting with Market Breadth Seminar: $199
or call 800-880-0338
